Note
Click here to download the full example code
Jittor Backend Example: RDKit Graph Matching
This example matches two SMILES forms of aspirin with RRWM. The affinity matrix is built from RDKit molecules and considers both node and edge affinities.
# Author: Runzhong Wang and Codex
# License: Mulan PSL v2 License

from io import BytesIO

import matplotlib.pyplot as plt
import numpy as np
import pygmtools as pygm
from PIL import Image
from rdkit import Chem
from rdkit.Chem import rdDepictor
from rdkit.Chem.Draw import rdMolDraw2D

pygm.set_backend('jittor')


def render_molecule(mol, width=420, height=280):
    drawer = rdMolDraw2D.MolDraw2DCairo(width, height)
    rdMolDraw2D.PrepareAndDrawMolecule(drawer, mol)
    atom_coords = np.array([
        [drawer.GetDrawCoords(i).x, drawer.GetDrawCoords(i).y]
        for i in range(mol.GetNumAtoms())
    ])
    drawer.FinishDrawing()
    image = np.array(Image.open(BytesIO(drawer.GetDrawingText())))
    return image, atom_coords


def show_pair(ax, img1, coords1, img2, coords2, lines=None):
    height = max(img1.shape[0], img2.shape[0])
    width1 = img1.shape[1]
    width2 = img2.shape[1]
    gap = 80
    offset2 = width1 + gap

    ax.imshow(img1, extent=(0, width1, height, 0))
    ax.imshow(img2, extent=(offset2, offset2 + width2, height, 0))

    if lines is not None:
        for idx1, idx2 in lines:
            ax.plot(
                [coords1[idx1, 0], coords2[idx2, 0] + offset2],
                [coords1[idx1, 1], coords2[idx2, 1]],
                '--', color='0.35', lw=1.0, alpha=0.75
            )

    ax.set_xlim(0, offset2 + width2)
    ax.set_ylim(height, 0)
    ax.axis('off')
Build the two molecular graphs for the Jittor backend
smiles1 = 'CC(=O)Oc1ccccc1C(=O)O'
smiles2 = 'O=C(O)c1ccccc1OC(=O)C'
mol1 = Chem.MolFromSmiles(smiles1)
mol2 = Chem.MolFromSmiles(smiles2)

rdDepictor.Compute2DCoords(mol1)
rdDepictor.Compute2DCoords(mol2)
0
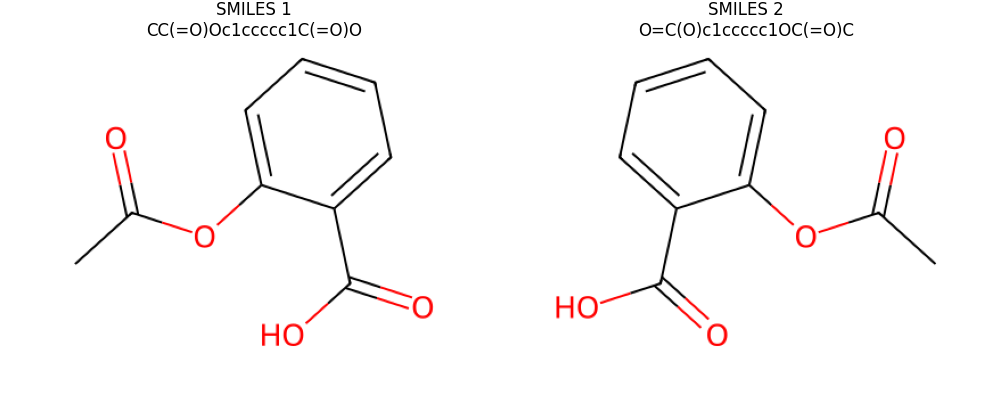
Visualize the two input molecules for the Jittor backend
img1, coords1 = render_molecule(mol1)
img2, coords2 = render_molecule(mol2)

fig, ax = plt.subplots(1, 2, figsize=(10, 4))
ax[0].imshow(img1)
ax[0].set_title(f'SMILES 1\n{smiles1}')
ax[0].axis('off')
ax[1].imshow(img2)
ax[1].set_title(f'SMILES 2\n{smiles2}')
ax[1].axis('off')
plt.tight_layout()
plt.show()
/mnt/c/Users/runzh/OneDrive/Documents/2022/pygmtools/examples/8.rdkit_graph_matching/plot_rdkit_graph_matching_jittor.py:88: UserWarning: FigureCanvasAgg is non-interactive, and thus cannot be shown
  plt.show()
Build the Jittor affinity matrix and solve with RRWM
K = pygm.utils.build_aff_mat_from_rdkit(mol1, mol2)
n1, n2 = mol1.GetNumAtoms(), mol2.GetNumAtoms()
X = pygm.hungarian(pygm.rrwm(K, n1=n1, n2=n2), n1, n2)
X = pygm.utils.to_numpy(X)
match = X.argmax(axis=1)
matched_pairs = [(atom_idx, int(matched_idx)) for atom_idx, matched_idx in enumerate(match)]
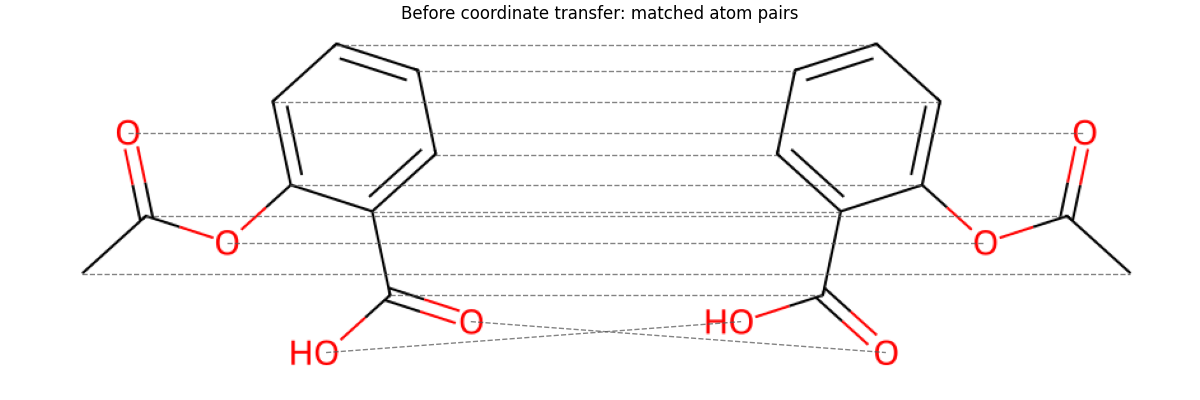
Visualize the Jittor matching before coordinate transfer
fig, ax = plt.subplots(figsize=(12, 4))
show_pair(ax, img1, coords1, img2, coords2, lines=matched_pairs)
ax.set_title('Before coordinate transfer: matched atom pairs')
plt.tight_layout()
plt.show()
/mnt/c/Users/runzh/OneDrive/Documents/2022/pygmtools/examples/8.rdkit_graph_matching/plot_rdkit_graph_matching_jittor.py:107: UserWarning: FigureCanvasAgg is non-interactive, and thus cannot be shown
  plt.show()
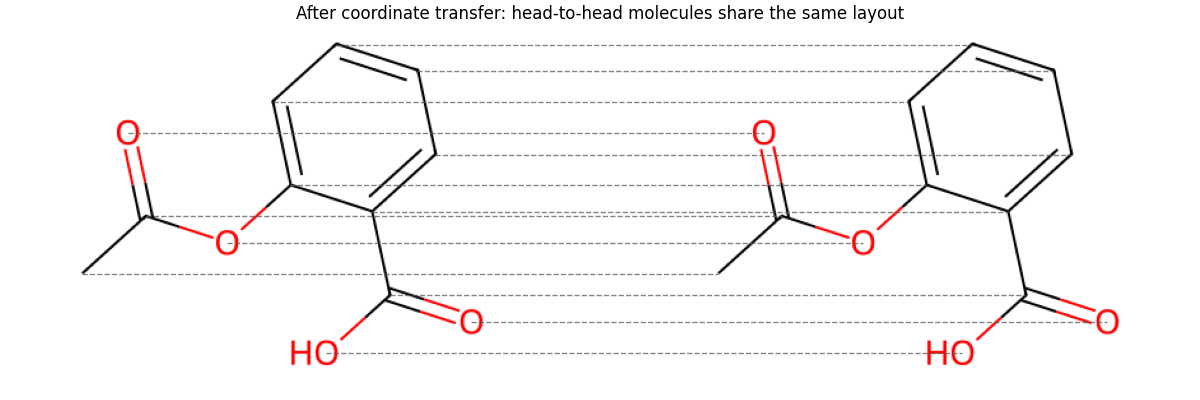
Transfer mol2 coordinates onto mol1 with the Jittor matching result
mol2_aligned = Chem.Mol(mol2)
conf2_aligned = mol2_aligned.GetConformer()
conf1 = mol1.GetConformer()
for atom_idx, matched_idx in matched_pairs:
    pos = conf1.GetAtomPosition(atom_idx)
    conf2_aligned.SetAtomPosition(matched_idx, pos)

img2_aligned, coords2_aligned = render_molecule(mol2_aligned)

fig, ax = plt.subplots(figsize=(12, 4))
show_pair(ax, img1, coords1, img2_aligned, coords2_aligned, lines=matched_pairs)
ax.set_title('After coordinate transfer: head-to-head molecules share the same layout')
plt.tight_layout()
plt.show()
/mnt/c/Users/runzh/OneDrive/Documents/2022/pygmtools/examples/8.rdkit_graph_matching/plot_rdkit_graph_matching_jittor.py:125: UserWarning: FigureCanvasAgg is non-interactive, and thus cannot be shown
  plt.show()
Total running time of the script: ( 0 minutes 6.626 seconds)